How Population, Health, and Wealth Relate to Olympic Success
This post utilises open data provided by the World Bank (Total Population, Life Expectancy, GDP) and the Summer Olympics medal dataset from Kaggle
Table of contents
Open Table of contents
1. Introduction
Felt the Olympics excitement at Paris this year? Same here.
It made me wonder why some countries consistently scoop up gold medals while others are ecstatic over a single bronze. Could these differences be due to a larger population, better health, or greater financial resources?
Let’s investigate data across 150 countries to see how population, health, and wealth relate to success at the Summer Olympics. Along the way, we’ll also explore how some nations manage to exceed expectations through focused strategies and investments.
2. Data Sources and What We Did
To get a clear picture, we gathered data from these publicly available sources:
- Summer Olympic Medal Counts (1960–2020): From Kaggle, originally sourced from Wikipedia
- Total Population (1960–2020): World Bank estimates
- Life Expectancy at Birth (1960–2020): World Bank estimates
- GDP (1990 - 2020): World Bank estimates, expressed in 2021 dollars and at Purchasing Power Parity (PPP) to account for differences in cost of living and inflation across countries
We calculated correlation coefficients to see how each factor relates to total medal counts. We also explore other potential factors that might influence Olympic performance.
3. Does a Bigger Population Mean More Medals?
Key Findings
Moderate positive correlation (r = 0.32): There’s a modest link between a country’s population size and its total medal count in the Summer Olympics.
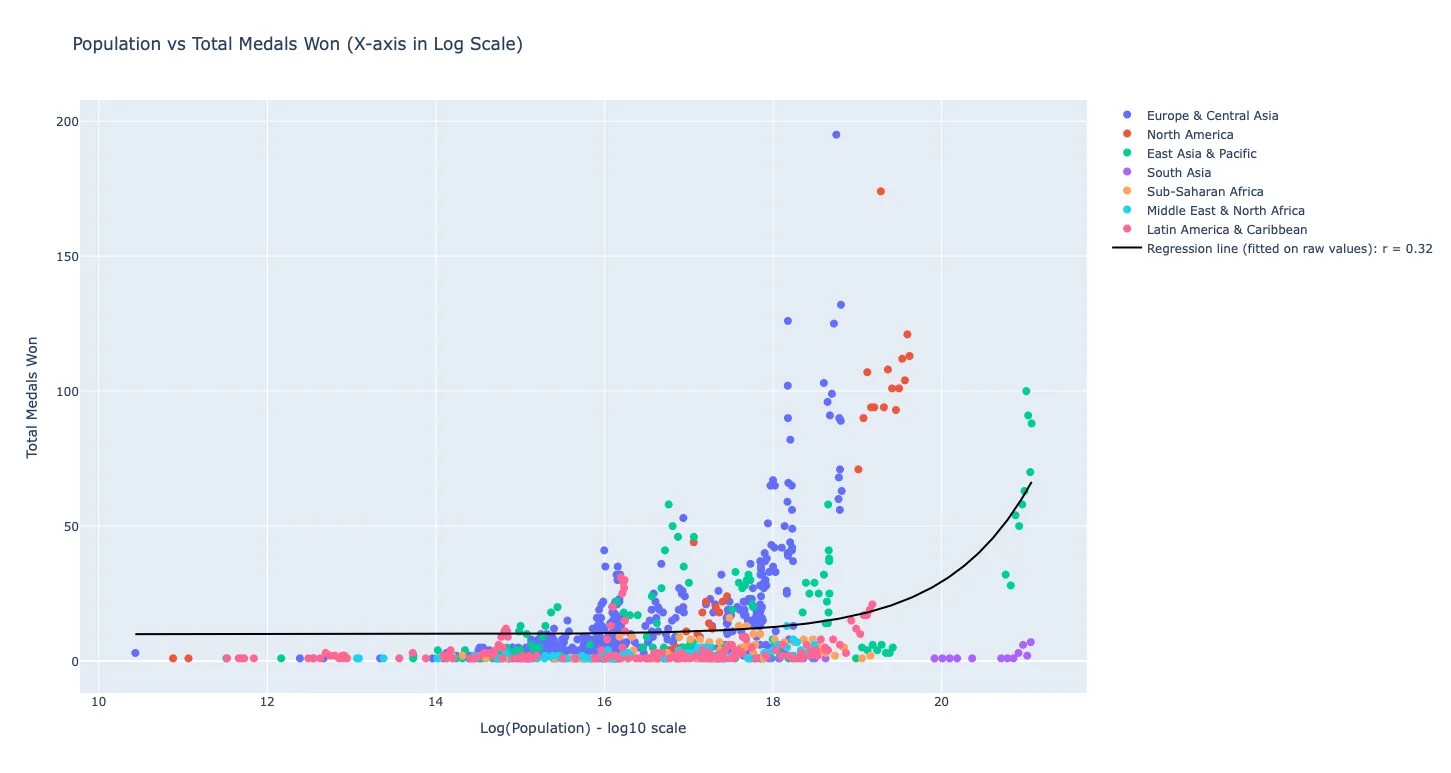
Data highlights:
| Country | Average Medal Count | Peak Medal Count | Average Population |
|---|---|---|---|
| United States (USA) | 105 per Olympics | 174 (in 1984) | 257 mil |
| China (CHN) | 63 per Olympics | 100 (in 2008) | 1.26 bil |
| Australia (AUS) | 29 per Olympics | 58 (in 2000) | 17 mil |
| Jamaica (JAM) | 6 per Olympics | 12 (in 2012) | 2 mil |
-
United States: With a large population, the United States has had consistent success. However, population alone does not explain its dominance, as we will observe in other examples below. (Note: 1984 medal peak coincided with Soviet-led bycott, potentially inflating medal counts for that year.) -
China: With one of the largest populations globally, China has a vast pool of potential world-class athletes. Yet, its medal count per capita is lower than the USA. From winning 28 medals in 1984 to 100 in 2008, it suggests factors beyond population may play key roles. Research has found factors like investment in sports infrastructure and focused resources in specific sports play a big role. -
Australia: Australia shines in the Olympic Games despite its smaller population, earning the majority of its medals through focused effort in swimming and athletics. -
Jamaica: Jamaica has a small population but is a sprinting powerhouse. With over 90% of its medals from sprint events, this small nation outperforms many larger countries.
Bottom Line
A bigger population gives a country more potential athletes, but it is not a clear link to Olympic glory. Countries like Australia and Jamaica show that specialization can help smaller countries shine on the world stage.
4. Is Life Expectancy Linked to Olympic Success?
Key Findings
Weak correlation (r = 0.19): There is a slight connection between life expectancy and medal counts, but it’s not strong.
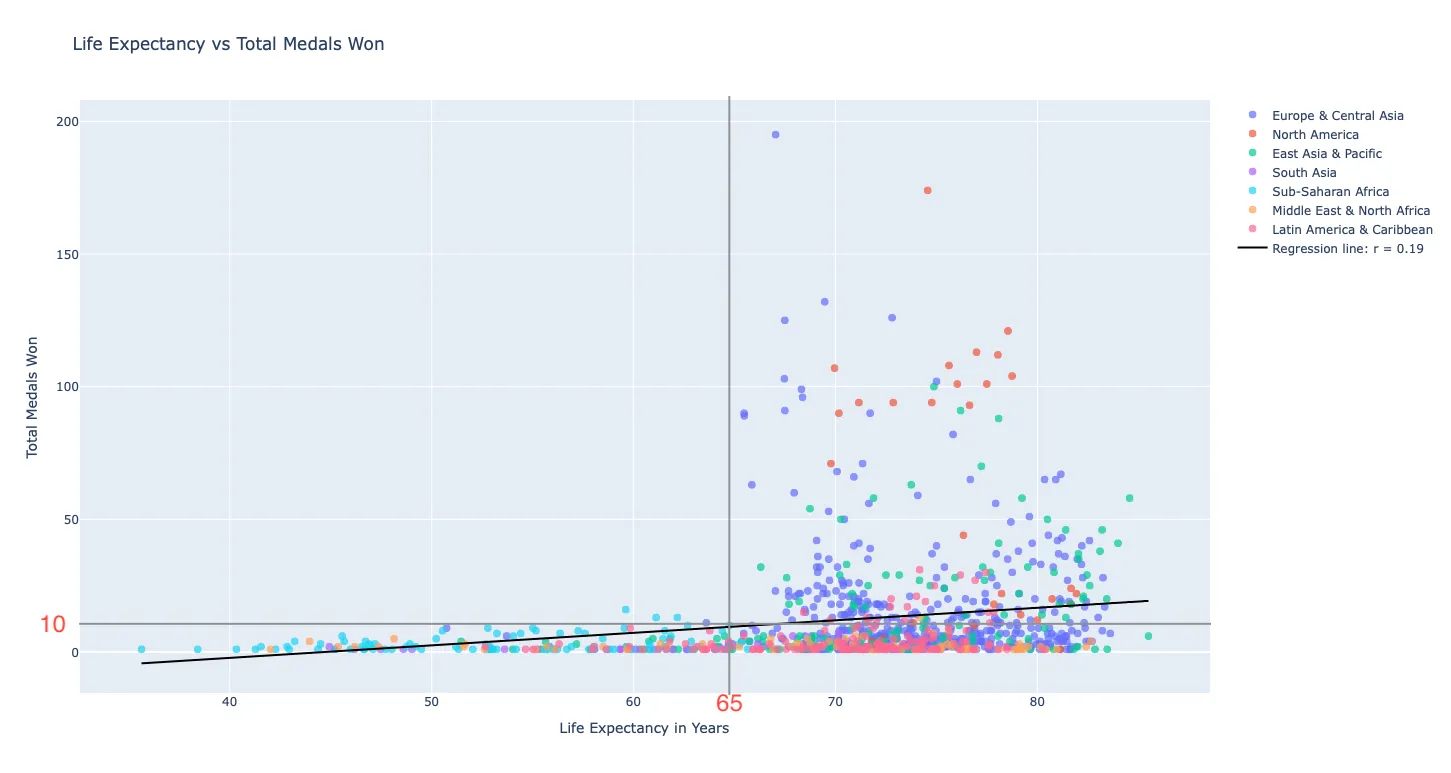
Data highlights:
- Across countries with life expectancies up to 65 years, medal counts vary widely between 0 - 10. Once life expectancy exceeds 65 years, the spread in medal counts becomes even more varied, with countries winning anywhere from 1 - 195 medals.
| Country | Life Expectancy (Years) | Total Medal Count |
|---|---|---|
| United States (USA) | 70 - 79 (avg: 75) | 71 - 174 (avg: 105) |
| Sweden (SWE) | 73 - 82 (avg: 78) | 4 - 19 (avg: 10) |
| Brazil (BRA) | 53 - 74 (avg: 65) | 1 - 21 (avg: 9) |
| Kenya (KEN) | 51 - 63 (avg: 58) | 1 - 16 (avg: 9) |
Sweden and Brazil: Although Sweden and Brazil have similar total medal counts, their differing life expectancies suggest that life expectancy may not be a significant factor in Olympic success.Kenya: Even with a lower life expectancy, Kenya has excelled in middle- and long-distance running at the Olympics. Research suggests that this is linked to factors like high-intensity training and strong motivation for economic and social advancement for Kenyan athletes, rather than general life expectancy.
Bottom Line
While life expectancy reflects a country’s general health, it’s not a strong predictor of Olympic success. Other factors like training methods, cultural emphasis on sports, and economic motivations may play more significant roles.
5. Does Higher GDP Mean More Medals?
Key Findings
Moderate-to-strong correlation (r = 0.78): There is a significant link between a country’s GDP and its Olympic medal counts. Research suggests investment in training resources play a key role in athletes’ success at the Olympics.
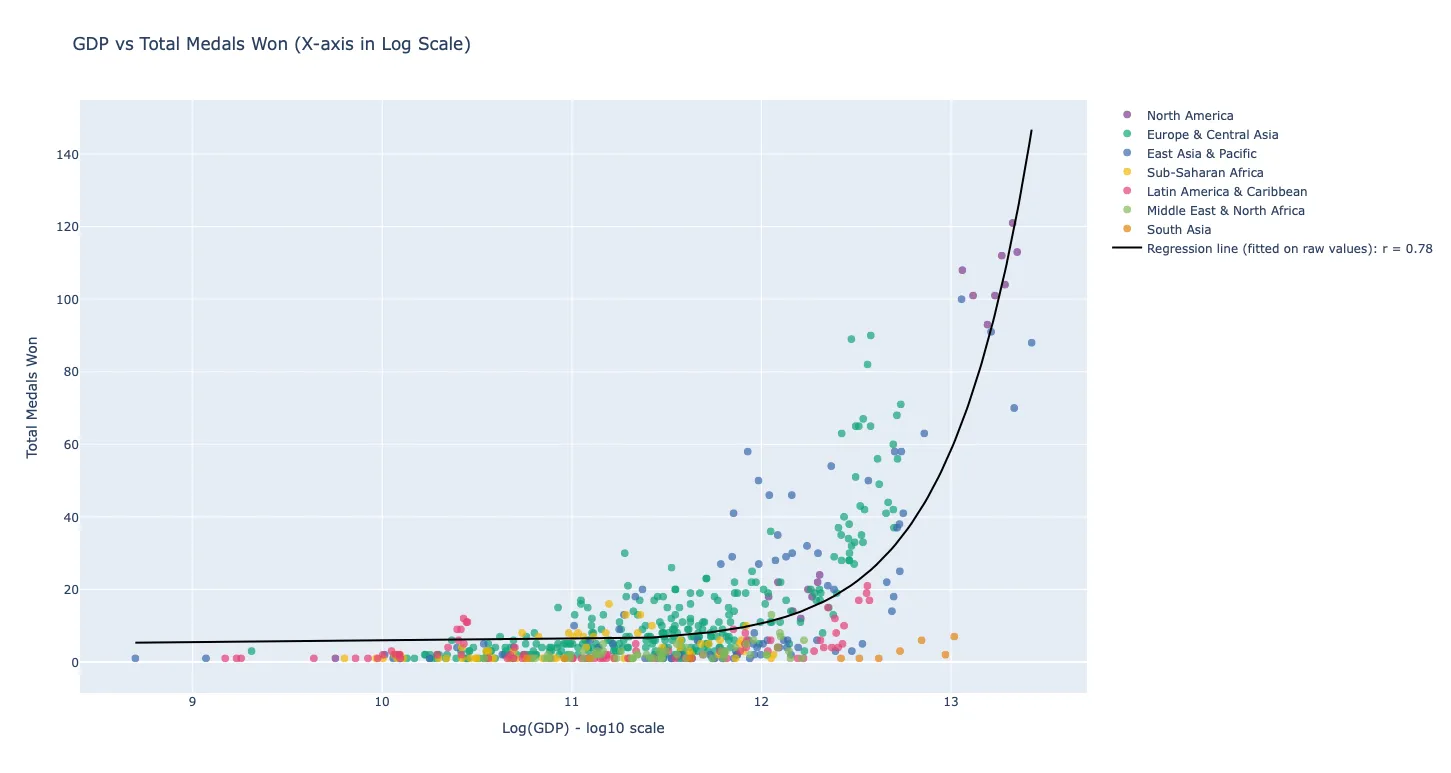
Data highlights:
| Country | GDP (PPP, $ trillion) | Total Medal Count |
|---|---|---|
| United States (USA) | $11 - $22 (avg: $17) | 93 - 121 (avg: 107) |
| China (CHN) | $2 - $27 (avg: $12) | 50 - 100 (avg: 72) |
| Australia (AUS) | $0.6 - $1.4 (avg: $1.0) | 27 - 58 (avg: 42) |
| Kenya (KEN) | $0.1 - $0.3 (avg: $0.2) | 7 - 16 (avg: 10) |
- The data (1990 - 2020) supports the idea that nations with high GDPs lead in terms of total medals won.
United States: With an average GDP (PPP) of $17 trillion, the US amassed 853 medals from 1990 to 2020, highlighting the link between economic strength and Olympic success.China: With an average GDP (PPP) of $12 trillion, China accumulated 574 medals. Moreover, as China’s GDP grew, so did its medal count, reinforcing a connection between wealth and Olympic success.Australia and Kenya: Both countries achieved impressive medal counts relative to their modest GDPs by excelling in specific sports — Australia mainly in swimming and athletics, and Kenya primarily in middle- to long-distance athletics.
Bottom Line
A country’s wealth has a moderate-strong link with its Olympic success. However, with strategic focus, countries with more modest economic resources can still achieve notable success as Australia and Kenya have shown.
6. Wrapping Up
Key Takeaways
Economic strength matters: Economic strength (GDP), is the most significant predictor of Olympic success among the three factors analyzed. Wealth enables investment in infrastructure, coaching, and athlete support.Population size isn’t everything: Population size only has a moderate link with Olympic success. A large population may offer a larger talent pool, but doesn’t predict more medals.Health Indicators: Life expectancy has little association with Olympic performance.Strategic focus matters: As Australia, Jamaica and Kenya demonstrate, countries can overcome economic and population disadvantages by focusing on sports where they can excel.
Acknowledging the Limitations
Correlation vs. causation: Just because GDP correlates well with medal counts doesn’t mean one causes the other. Many factors contribute to Olympic success, including a well-functioning athlete development program and cultural emphasis on sports.Data variability: Differences in data quality and reporting standards can affect the analysis. Data has been sourced from public sources like the World Bank to minimize, but will not eliminate the effects of data variability.
Looking Ahead
Helping athletes reach their Olympic dreams isn’t a simple task. Looking ahead, it would be great to explore how other things like funding for sports, different ways to nurture young athletes, and government actions affect how countries perform at the Olympics.
And while we cheer for our own countries in the medal standings, the Olympics are also a celebration of our shared human potential and unity.
As the Olympic creed says:
The important thing in life is not the triumph, but the fight; the essential thing is not to have won, but to have fought well.
Let these words inspire not just the athletes, but all of us, to strive for a better future together.
Further Reading: